
Fidelity Bank Q1 2026: When Fresh Capital Can’t Mask Margin Collapse and Soaring Credit Costs

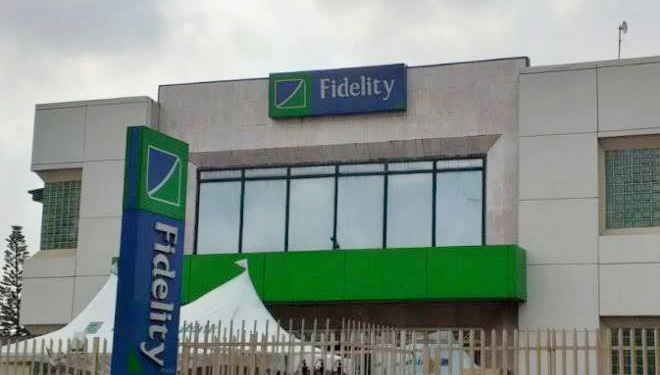
Fidelity Bank enters Q1 2026 with three structural advantages that now define Nigerian banking. Macro validation came first. S&P Global Ratings lifted Fidelity to B from B- in the same week Nigeria’s sovereign rating improved, putting the bank among seven institutions singled out for stronger credit profiles. The second is structural change. The NGX is days away from moving to T+1 settlement, a shift that will reward liquidity, speed, and balance sheets that can turn over quickly. The third is capital reality. Fidelity closed a N227bn equity raise in the quarter, pushing equity to N1.39trn and equity to assets to 12.21%. Those three facts frame everything in the results, and they explain why analyst views on the stock are splitting even as the sector is broadly favored.
Top-line growth in Q1 looks strong but masks pressure beneath it. Gross earnings rose 37.9% year on year to N434.9bn. Interest income using the effective interest rate method grew 22.8% to N314.5bn, other interest income jumped 53% to N38.8bn, and foreign currency revaluation added N48bn versus N9.8bn a year earlier. Fee and commission income was up 39.7% to N33.3bn, showing that transaction banking and retail are contributing. On the surface this is a bank benefiting from higher rates, currency liberalization, and volume. The problem begins below net interest income. Interest expense almost doubled to N172.5bn from N90.7bn. That 90.3% surge in funding cost erased the asset yield gains. Net interest income actually fell 5.3% to N180.8bn. Once credit loss expense is included, the damage is clearer. Impairments jumped 364.7% to N29.2bn, dragging net interest income after impairment down 17.9% to N151.6bn. The message is that the rate cycle that lifts asset yield is the same cycle that reprices deposits, and for Fidelity in Q1 the liability side moved faster.
Operating costs are rising faster than income, and efficiency is slipping. Personnel expenses were flat, but depreciation and amortization rose 46% to N12.6bn and other operating expenses climbed 19.4% to N104.5bn. Total operating expenses reached N136.8bn, up 18.1%. Operating income grew 13.5% to N258.6bn, so cost to income moved to 52.91% from 50.83% a year earlier. The bank is investing, likely in technology and branches, as intangibles nearly doubled to N95.2bn from N50.4bn in December. That investment is necessary for T+1 and for digital competition, yet in the short term it weighs on efficiency. Profit before tax fell 12.6% to N92.5bn and profit after tax dropped 18.3% to N74.5bn. Annualized return on average equity came to 24.08% versus 39.81% in Q1 2025. The dilution is partly arithmetic, because average equity rose to N1.24trn after the share issue, but the lower profit is the bigger driver.
The balance sheet is why analysts still assign upside despite earnings compression. Customer deposits grew 7.1% in three months to N7.38trn. Loans rose 8.7% to N4.66trn, keeping loan to deposit at a conservative 63.07%. Cash and cash equivalents plus restricted balances with the CBN total N3.25trn, which is 44% of deposits. Investment securities stand at N2.66trn. This is a liquid bank. Under T+1, liquidity is not just a regulatory metric. It is a competitive tool. Funds that can settle faster will gravitate to names that do not create counterparty or funding drag. Fidelity’s liquidity, plus the S&P upgrade, gives it institutional credibility that smaller banks lack. The equity raise further cements that position. Share capital and premium jumped to N532.6bn from N305.6bn in December, and total equity of N1.39trn provides headroom for the CBN’s recapitalization program and for risk asset growth.
Analyst calls are diverging because strategy and earnings are sending different signals. BlueMarina moved Fidelity from Hold to Buy with a 32.3% projected upside, explicitly tying the call to the improved credit outlook and capital. Capital Bancorp went the other way, cutting the stock from Buy to Hold. The report notes that some capital market operators are now balancing improved credit fundamentals against recent price performance and valuation considerations. That is the crux for the market in May 2026. The banking sector is the clear beneficiary of macro upgrades, but the easy money from sentiment has been made. The next phase is selective, and it depends on who can translate liquidity and ratings into net interest margin and return on equity.
Peer comparison shows Fidelity is in a distinct position within the S&P upgrade cohort. Stanbic IBTC also received the S&P upgrade, yet both BlueMarina and Capital Bancorp hold it at Hold. The logic in the CMO note is identical. The upgrade is real, but valuation may already reflect it. Wema Bank was not upgraded and was only reinstated to Hold by BlueMarina with no upside target. In that context Fidelity is unique among the three. It has the upgrade, the fresh capital, and at least one Buy rating. That combination is why it sits in the “constructive” basket while Stanbic is “cautious” and Wema is “neutral”. The market is not buying banks as a block. It is buying specific balance sheet stories.
Three variables will determine whether Fidelity converts positioning into performance. Margin is first. Asset yield annualized at 19.33% and cost of funds at 8.51% produce a net interest margin of 10.01% annualized. That is down roughly 90 basis points from a year earlier if one estimates using similar asset levels. With deposits at N7.38trn, every 100 basis points of funding cost is N73.8bn in annualized expense. Fidelity’s ability to reprice loans, grow low cost deposits, and use the new capital to book quality risk assets will determine whether NIM recovers. The second is credit. The 4.6x jump in credit loss expense to N29.2bn is the largest swing in the income statement. It represents 0.63% of gross loans for the quarter, or 2.5% annualized. If that level persists, it will consume much of the benefit from higher rates. The bank’s NDR reserve of N299.7bn and total equity give it capacity to absorb losses, but sustained high provisions will keep return on equity below the 30% levels investors saw last year. The third is efficiency under T+1. A cost to income ratio above 52% is workable in Nigeria, yet the direction matters. If T+1 drives more volume and fee income, Fidelity’s investment in intangibles and its liquid balance sheet could let it scale revenue faster than costs. If volume does not come, the higher cost base will continue to drag.
Q1 2026 sets up a clear test for Fidelity: strong capital must now deliver stronger earnings. The bank has done the strategic things right. It raised capital ahead of the curve, secured a rating upgrade, and maintained a liquid, conservative balance sheet. The market has noticed, and part of the analyst community is willing to pay for that optionality. At the same time, the quarter shows how quickly monetary policy and credit normalization can hit earnings. Funding costs and impairments took N107.6bn more out of the income statement than last year. That is the trade off investors must price. In a market shifting to T+1, where settlement speed and counterparty strength matter more, Fidelity’s structural advantages are real. The next two quarters will test whether those advantages convert into margin recovery, cost control, and asset quality stability. If they do, the BlueMarina upside case is credible. If they do not, the Capital Bancorp caution will look prescient. The data for March 2026 does not resolve that debate. It sets it up.