
Dangote Cement Plc H1 2026 Results: Record Profit, Higher Margins and a Swing to Positive Net Cash

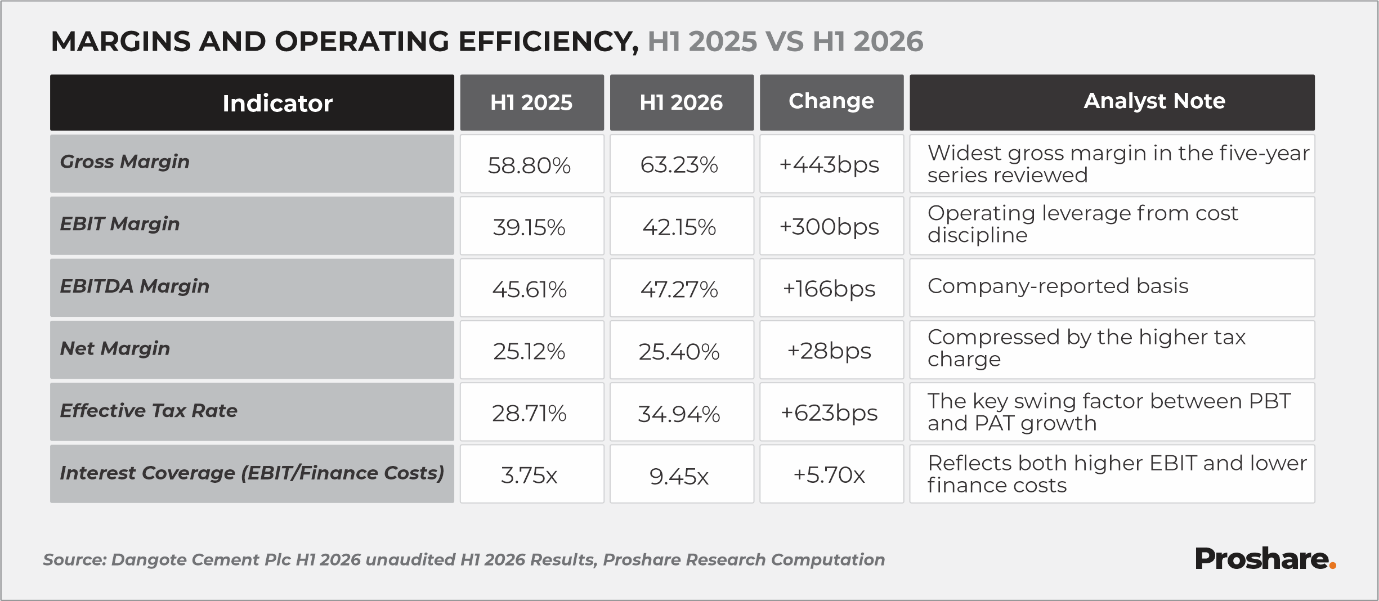
Dangote Cement closed H1 2026 with its strongest half-year profit on record, delivering N638.53bn in PAT on N2.51trn of revenue, a 21.35% topline increase driven by 11.79% higher sales volumes and a rise in Nigerian export shipments. Gross margin grew to 63.23%, and EBITDA margin rose to 47.27%, both multi-year highs, as cost of sales grew slower than revenue. The more consequential shift, however, sits on the balance sheet: total borrowings nearly halved to N581.04bn while cash and bank balances doubled to N796.28bn, swinging the Group from a net debt position of N682.92bn at FY 2025 to a net cash position of N215.24bn in H1 2026, a deleveraging move funded by strong operating cash generation (net cash from operations up by 20.82% to N1.06trn) rather than new borrowing, since no fresh loans were drawn in the period.
Underneath the headline numbers, the improvement is uneven. Nigeria carried the result: its EBITDA margin rose by 153 basis points to 60.14% on a favourable energy mix and cost containment, aided by a 62.30% increase in export volumes to Ghana, Cameroon and Cote d’Ivoire. Pan-Africa told a different story: volumes recovered by 19.05%, but segment EBITDA fell by 0.43%, and margin narrowed by 250 basis points to 17.61%, dragged down by Cameroon (post-election disruption) and Ghana (pricing controls and competitor undercutting), even as Ethiopia, Tanzania and Senegal posted strong gains. At the Group level, the effective tax rate rose by 623 basis points to 34.94%, which meant that a 34.43% rise in profit before tax translated into only 22.69% PAT growth and 24.33% EPS growth (the tax line, not operations, was the main brake on bottom-line momentum).
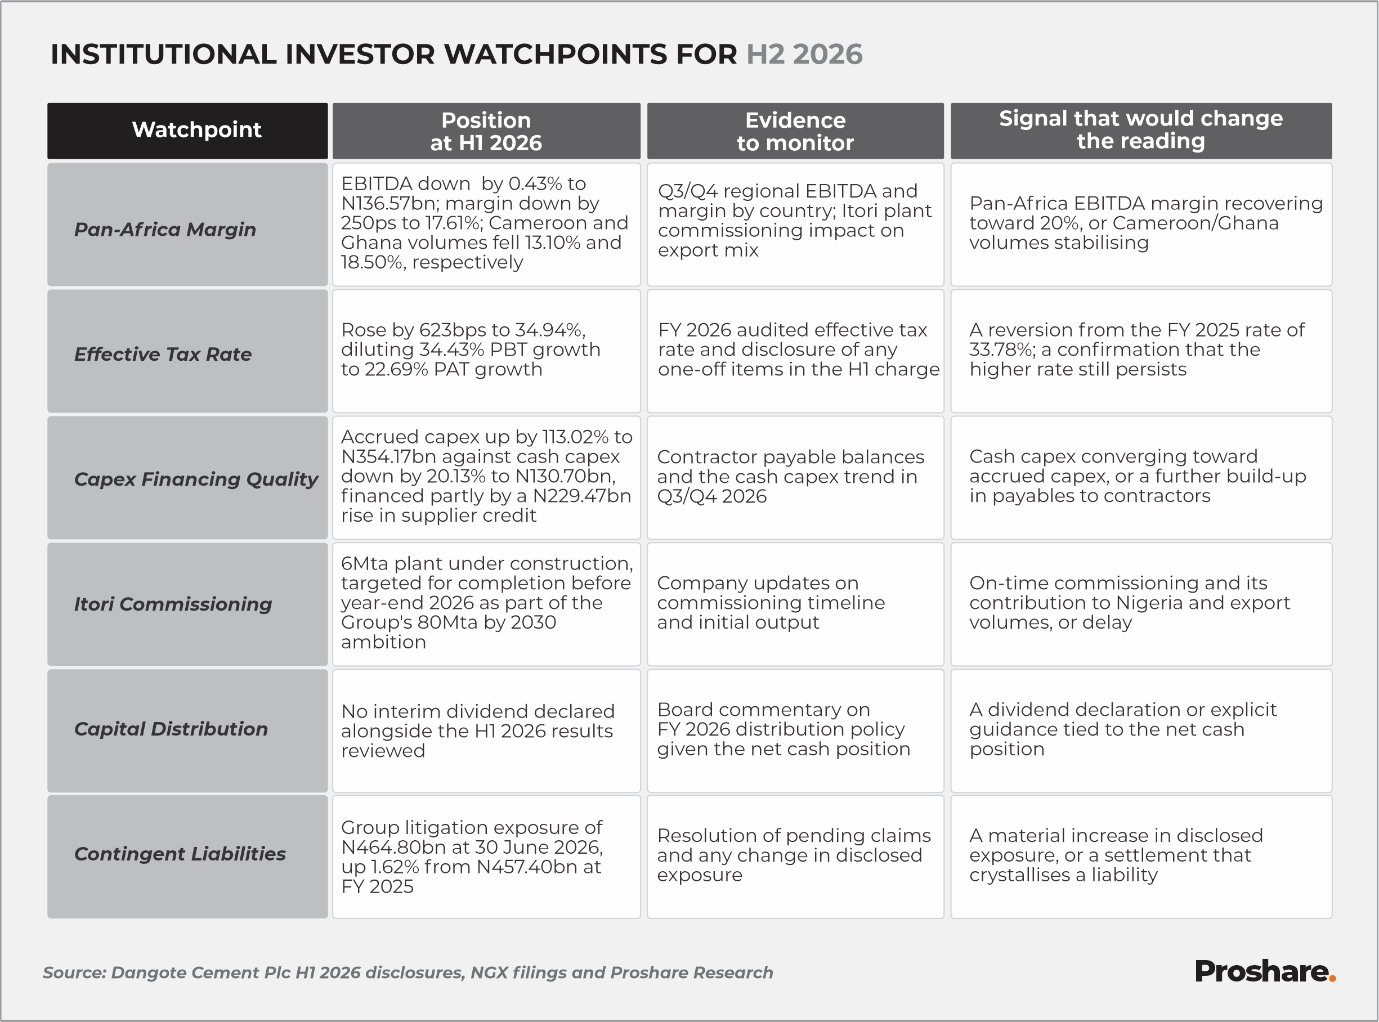
Positioned against BUA Cement and HBM Nigeria, Dangote Cement retains unmatched scale: N2.51trn in revenue, N3.17trn in equity and the sector’s largest market capitalisation at N17.45trn, but its 21.35% revenue growth and 22.69% PAT growth were the slowest of the three, and the stock’s unannualised P/E of 27.05 times sits below BUA Cement’s 32.95 times. Capital expenditure on an accrued basis more than doubled to N354.17bn even as cash capex paid fell by 20.13% to N130.70bn, meaning a growing share of the investment programme is being carried out through supplier credit rather than cash outflow, a financing pattern the company itself flags as worth monitoring. With no interim dividend declared and the Group now sitting in a net positive cash position, H2 2026 will turn on four questions the report poses directly: whether Pan-Africa’s margin recovers alongside its volumes, whether the effective tax rate normalises, whether the Itori plant commissions on schedule, and whether the Board addresses capital distribution now that leverage is no longer a constraint.
Financial Performance
Dangote Cement Plc announced its unaudited results for the three months and six months ending June 30, 2026. Group revenue increased by 21.35% to N2.51trn, driven by an 11.79% rise in sales volume to 14.94 million tonnes. Nigeria’s sales grew by 8.33% to 9.70 million tonnes, while Pan-Africa volumes increased by 19.05% to 5.95 million tonnes. Gross profit rose by 30.51% to N1.59trn, with gross margin rising by 443 basis points to 63.23%. This reflects cost of sales rising by 8.29%, below the 21.35% growth in revenue. The Chief Executive Officer, Arvind Pathak, credited the performance to higher sales volumes, disciplined execution, and sustained demand, noting the Group finished the period with cash exceeding its total debt.
Table 1:
Segment Performance: Nigeria and Pan-Africa
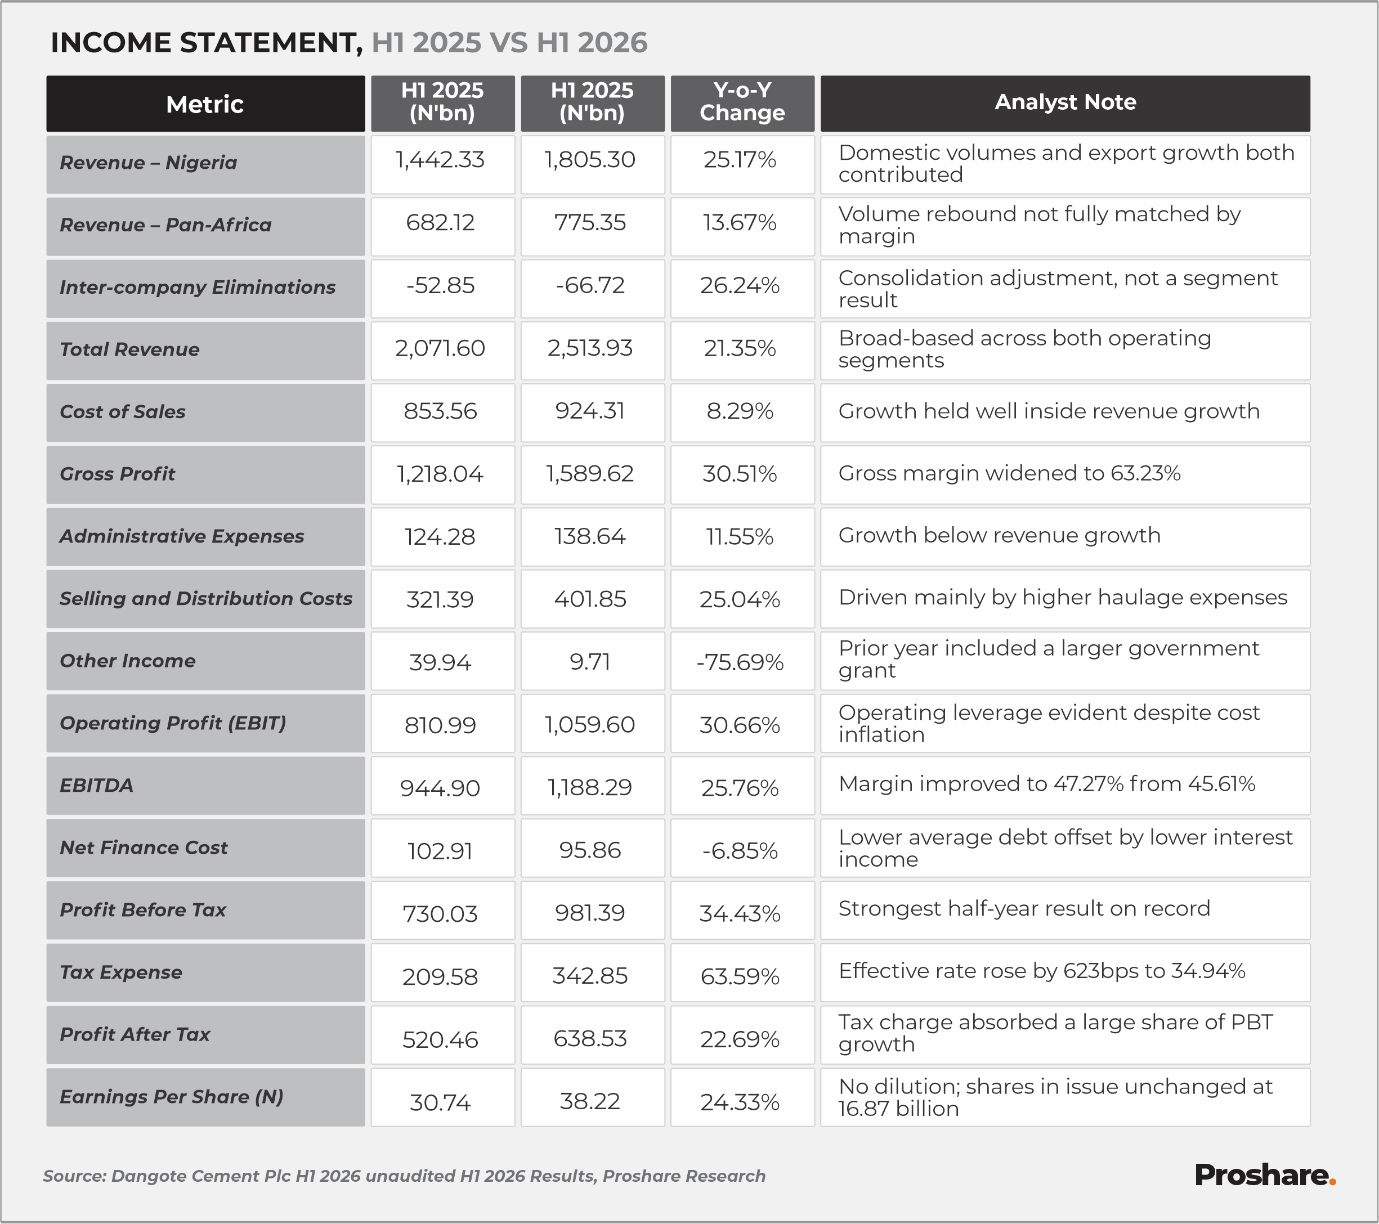
The Group reports two segments by location of operations: Nigeria and Pan-Africa. Nigeria’s revenue rose by 25.17% to N1.81trn on 8.33% higher volumes, supported by pricing discipline and a 62.30% increase in Nigerian cement and clinker export volumes to Ghana, Cameroon and Cote d’Ivoire, following twenty clinker shipments during the period. Nigeria EBITDA rose by 28.43% to N1.09trn at a margin of 60.14%, up by 153 basis points from 58.61% in H1 2025. This improvement is attributable to a favourable energy mix and cost containment rather than pricing alone, given that Nigerian inflation picked up to 15.91% in June and the Central Bank of Nigeria held its benchmark rate at 26.50% through the second quarter.
Pan-Africa volumes rebounded by 19.05% to 5.95 million tonnes, but revenue growth of 13.67% to N775.35bn did not translate into EBITDA growth. The segment EBITDA fell by 0.43% to N136.6bn and the margin narrowed by 250 basis points to 17.61%. The regional picture was uneven as Cameroon volumes fell by 13.10% on post-election disruption to construction activity, Ghana volumes fell by 18.50% on government pricing controls and competitor undercutting, and Zambia volumes fell by 5.90%, while Ethiopia (+30.40%), Tanzania (+26.10%), Senegal (+32.00%) and South Africa (+1.70%) posted gains, and the newly commissioned grinding plant in Cote d’Ivoire added 324.3Kt (0.32 million tonnes) of incremental volume. Proshare’s reading is that the Pan-Africa segment’s volume recovery has not yet been matched by margin recovery, and that Cameroon and Ghana are the two markets bearing closest watching into H2 2026.
Financial education courses
Table 2:
Margins and Operating Efficiency
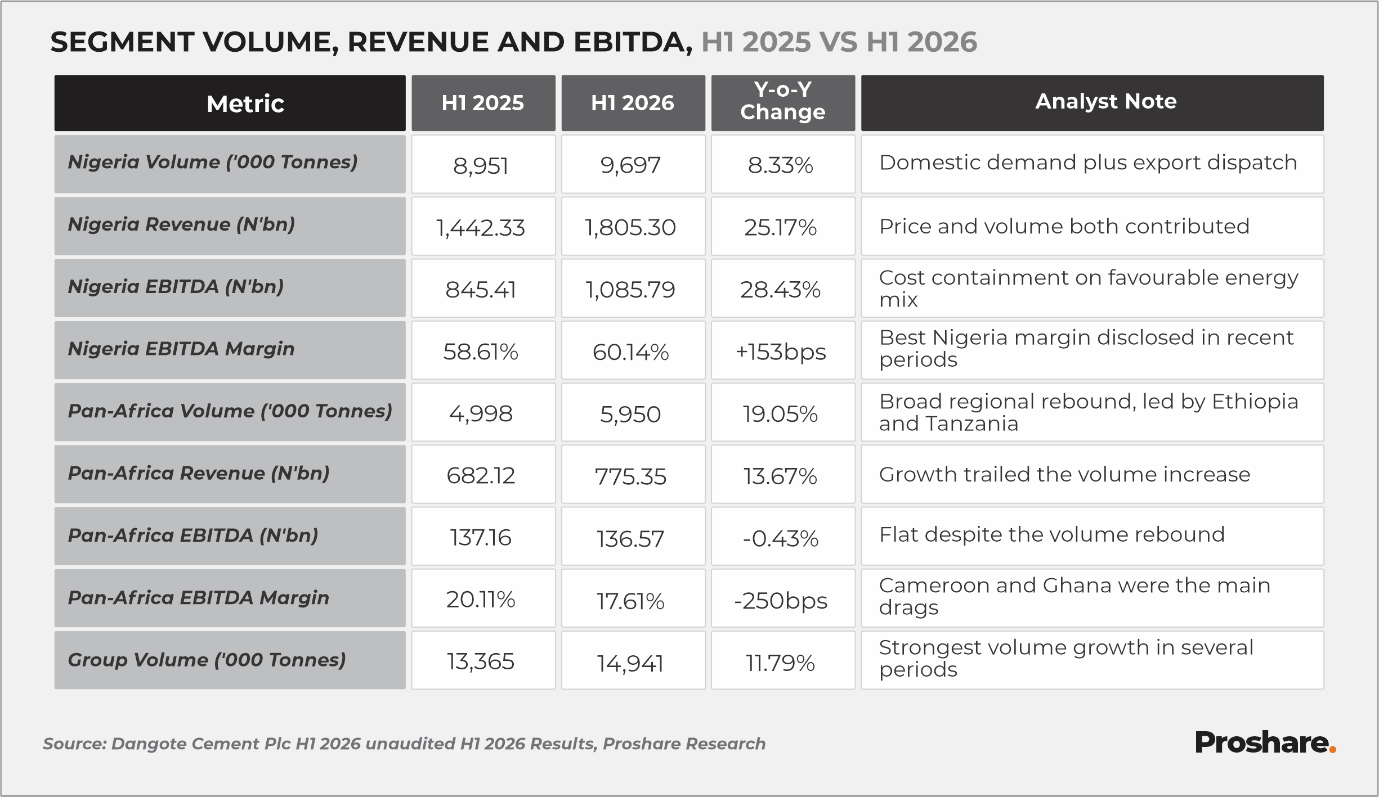
Margin increases were broad-based. The gross margin widened by about 443 basis points to 63.23% as cost of sales grew more slowly than revenue, and the EBIT margin grew by 300 basis points to 42.15%. EBITDA margin improved by 166 basis points to 47.27%. Net margin was comparatively flat, up by only 28 basis points to 25.40%, because the effective tax rate absorbed most of the additional operating profit. Interest coverage improved to 9.45 times EBIT from 3.75 times, reflecting both higher EBIT and a 48.14% reduction in finance costs from N216.16bn in H1 2025 to N112.11bn in H1 2026.
Table 3:
Cash Flow and Capital Expenditure
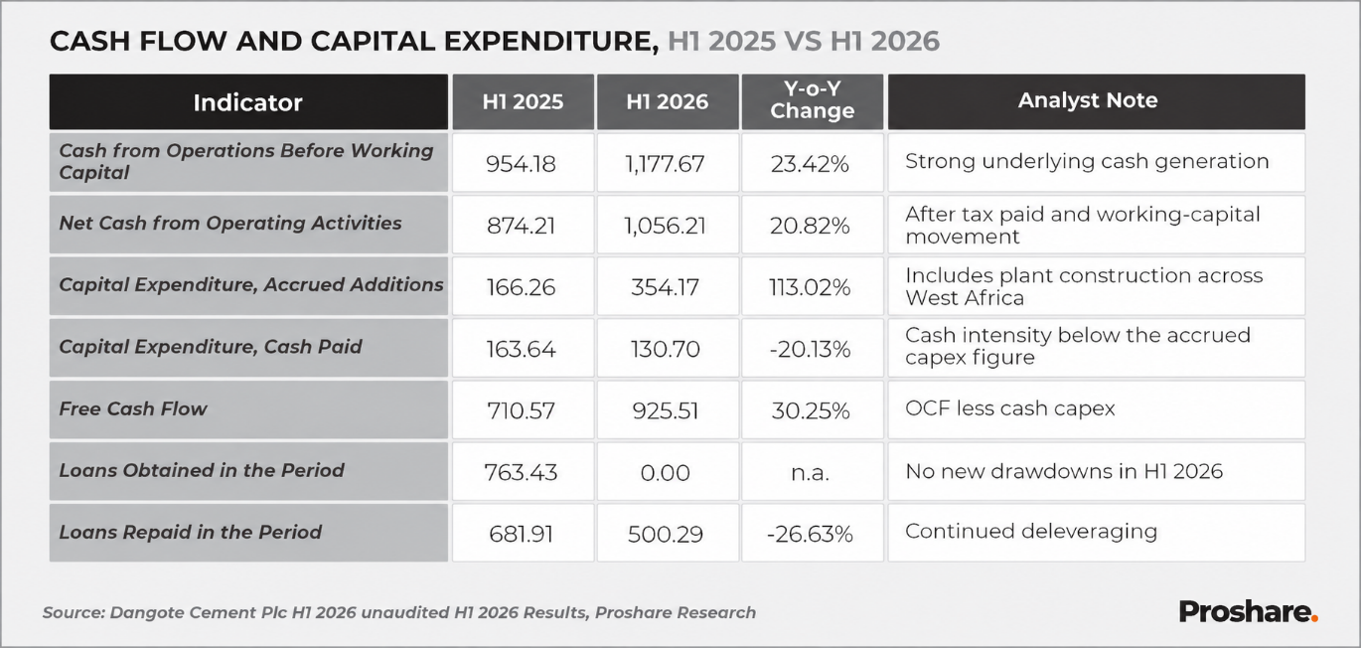
Cash generated from operations before working capital changes rose by 23.42% to N1.18trn, and net cash from operating activities rose by 20.82% to N1.06trn. Capital expenditure on an accrued basis more than doubled to N354.17bn, split N314.17bn in Nigeria and N40.00bn in Pan-Africa. The cash paid for property, plant and equipment, however, fell by 20.13% to N130.70bn. The Group’s free cash flow declined by 0.83% to N702.04bn in H1 2026 from N707.95bn in H1 2025. Separately, the Group made no new loan drawdowns in H1 2026 against N763.43bn obtained in H1 2025, while loan repayments of N500.29bn continued the deleveraging evident in the balance sheet.
Table 4:
Balance Sheet, Leverage and Liquidity
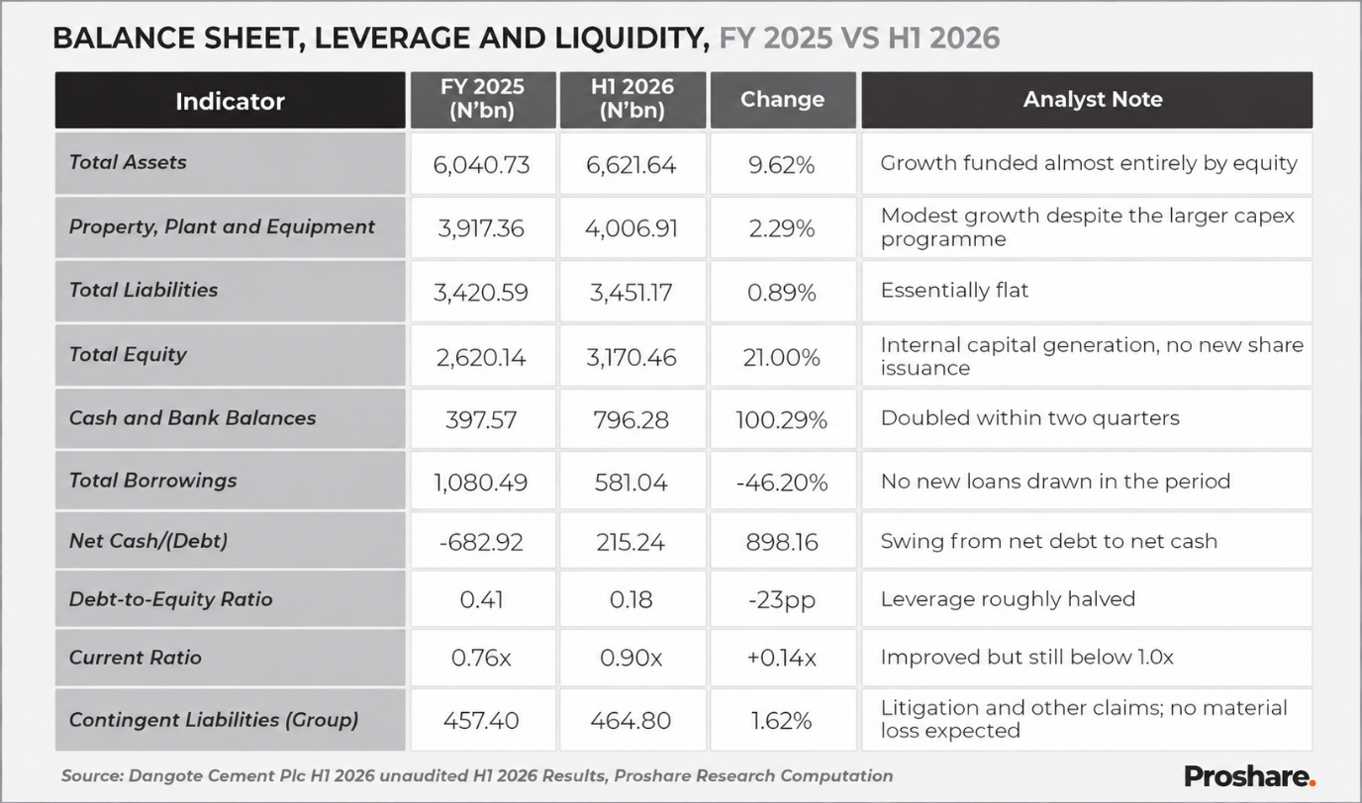
Dangote Cement’s total assets grew by 9.62% to N6.62trn in H1 2026 from N6.04trn in FY 2025, while total liabilities were nearly flat, up by 0.89% to N3.45trn, so the growth in the balance sheet was funded almost entirely by equity, which rose by 21.00% to N3.17trn on retained earnings. Cash and bank balances doubled to N796.28bn in H1 2026 from N397.57bn in FY 2025, while total borrowings were nearly halved to N581.04bn from N1.08trn in FY 2025, moving the Group from a net debt position of N682.92bn at FY 2025 to a net cash position of N215.24bn, a swing of N898.16bn. Borrowings fell to about 18.33% of total equity from 41.24% at FY 2025. The current ratio improved to 0.90x from 0.76x, though it remains below 1.0x, and contingent liabilities in respect of pending litigation and other claims stood at N464.80bn for the Group, up by 1.62% from N457.40bn at FY 2025; management has assessed that no material loss is expected to arise from these claims.
Table 5:
Market Performance and Valuation
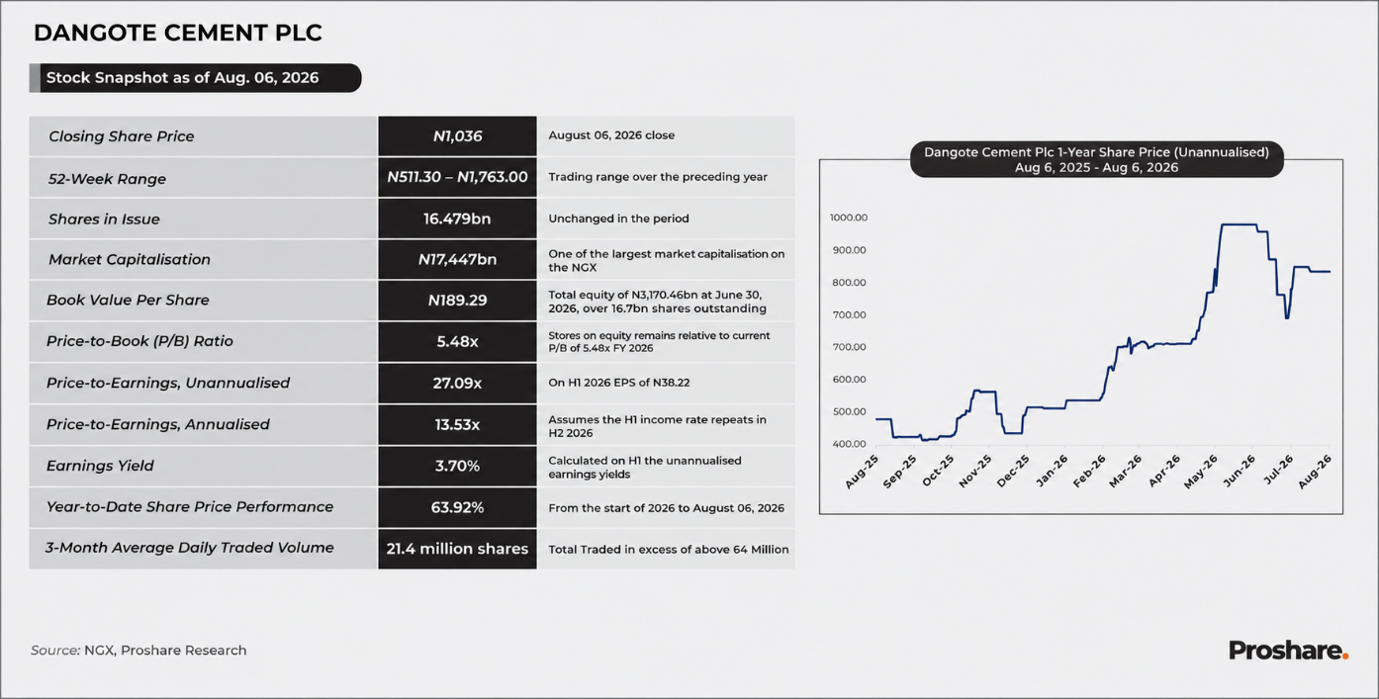
Dangote Cement stock closed at N1,034 on August 06, 2026, near the top of its 52-week range of N511.20–N1,180.00 and up by 69.79% year-to-date, valuing the Group at N17.45trn on 16.87 billion shares in issue, one of the largest market capitalisations on the NGX. Three-month average daily traded volume stood at 2.14 million shares, with total three-month turnover of about N199.13bn on 181.29 million shares traded.
As of August 06, 2026, the stock traded at 27.05 times unannualised H1 2026 earnings per share of N38.22, or 13.53 times on an annualised basis that assumes the H1 income mix repeats in H2 2026. On book value, using total equity of N3.17trn including non-controlling interests, the stock traded at 5.50 times book (5.68 times on equity attributable to owners of the parent only).
Illustration 1:
Peer Comparison: Dangote Cement, BUA Cement and HBM Nigeria
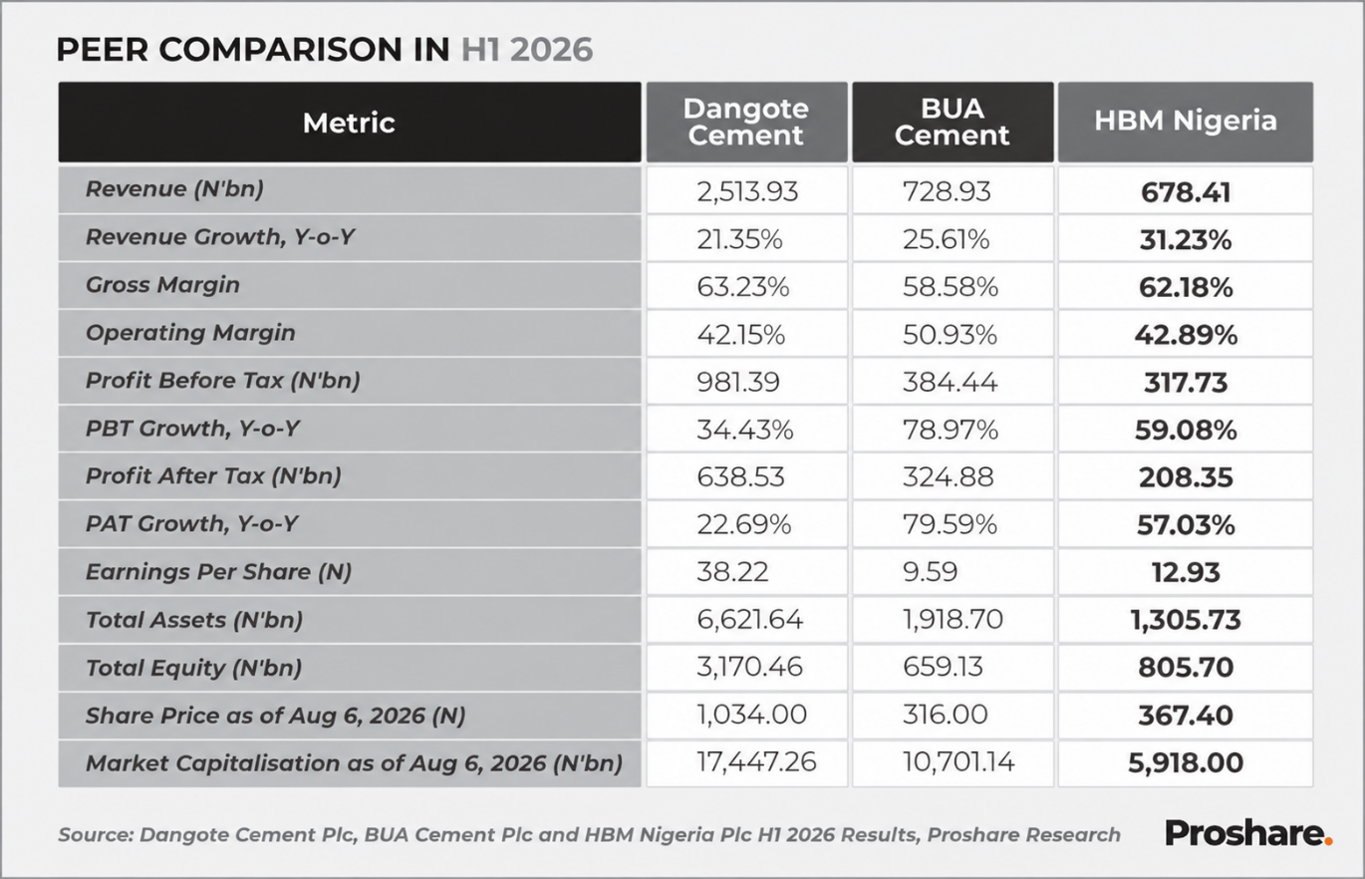
H1 2026 peer comparison highlights a trade-off between scale, growth, and operating performance among Nigeria’s listed cement producers. Dangote Cement’s H1 2026 performance underscores its continued dominance of Nigeria’s listed cement sector, with N2.51trn in revenue, N638.53bn PAT and N3.17trn in equity, exceeding its peers in absolute earnings and balance-sheet scale. However, its 21.35% revenue growth and 22.69% PAT growth lagged BUA Cement and HBM Nigeria, indicating slower earnings momentum despite its market leadership. Its 63.23% gross margin remained strong and broadly comparable with HBM Nigeria, although the reported 42.15% operating margin is below peers and warrants further examination of operating cost and expense classifications.
At N17.45trn, Dangote Cement also commands the sector’s largest market capitalisation, while its unannualised P/E of 27.05 times remains below BUA Cement’s 32.95 times and in line with HBM Nigeria (26.41 times), suggesting that the market continues to price its superior scale, earnings capacity and balance-sheet strength, even as investors may increasingly look for stronger growth to justify its valuation premium.
Table 6:
H2 2026 Investor Watchpoints
Six indicators will determine whether the H1 2026 result marks a durable step-up in profitability or a half-year shaped by items that may not repeat.
Table 7:
Closing Thoughts and Forward Outlook
Dangote Cement begins the second half of 2026 with its strongest half-year profit on record, a Group EBITDA margin at a multi-year high, and a swing from net debt to net positive cash within just two quarters. The key drivers of this performance are Nigeria’s export momentum, improvements in Nigeria’s EBITDA margin, and reduced finance costs. Although Pan-Africa’s volume recovery has started, margins have not yet improved proportionally. Additionally, the rise in the effective tax rate has limited earnings-per-share growth compared to profit-before-tax growth. It is also important to monitor the quality of capital expenditure now that a larger portion of the investment program is being financed through supplier credit instead of cash.
Relative to BUA Cement and HBM Nigeria, Dangote Cement’s H1 2026 growth rate was the slowest of the three even as its scale and balance sheet strength remained unmatched. Whether the Itori plant commissions on schedule, whether the effective tax rate normalises, and whether the Board addresses capital distribution given the net positive cash position are among the questions H2 2026 will need to answer.