United Bank for Africa (UBA) Plc has successfully concluded its Rights Issue, raising approximately N157.84 billion in additional capital. The offer involved 3,156,869,665 ordinary shares of 50 kobo each at N50.00 per share, based on one new ordinary share for every 13 ordinary shares held as of July 16, 2025. However, while the exercise has been successfully completed, no doubt, it sent a strong signal to the bank’s leadership. The recently concluded Right issue was not an easy push . Due to the lethargic response from the investors to it , the bank had to extend the sale that was Initially set to close on September 5, 2025 to September 19, 2025, “giving shareholders more time to participate.”
But the investors’ attitudes shouldn’t spring any surprise. In the first place,the question remains : should UBA’s public offer and rights issue be considered by any serious and informed investor, especially anyone who has had a rough experience with past offers?
Surely not by those who participated with their hard-earned money in the UBA ₦54 billion hybrid offer of 2007, in which a public offer of 1,127,400,000 ordinary shares was presented to the market at ₦35.00 per share and a rights issue of 423,600,000 ordinary shares at ₦34.00 per share was offered, may have to think twice about the ongoing offer presented by the same bank.
The above view may not be farfetched. It was like a nightmare for investors who bought in at ₦34 in 2007 when (UBA) lthe share price adjusted to ₦11.56 in 2008 following annual results, from a previous ₦15.20. The period from 2007 to 2010 was a tumultuous time for United Bank for Africa (UBA), one of Nigeria’s leading financial institutions. The bank’s share price experienced significant volatility, influenced by both global and local factors.
UBA’s stock began 2007 on a high note, building on the Central Bank of Nigeria’s consolidation reforms. The share price surged from N12 on August 1, 2006, to a peak of N37.99 by February 6, 2007. However, by November 2007, early signs of volatility emerged, with the stock losing N4.77 in one week, closing at N50.15 per share (adjusted for stock splits and other corporate actions).
Consequently, the global financial crisis that started in 2008 had a devastating impact on the Nigerian stock market, and UBA’s share price plummeted. On November 15, 2008, UBA’s share price was adjusted to N11.56, a significant drop from its previous closing price of N15.20. The bank’s 2008 annual report highlighted the market’s poor performance, reflecting the steep fall in share value that year.
Furthermore, the Nigerian banking crisis intensified in 2009, with the Central Bank intervening in several banks. UBA’s share price remained low, trading around N10 per share, according to the bank’s 2009 annual report. The tough market conditions were compounded by other challenges, including increasing operating costs.
As a result, the Nigerian stock market struggled to recover from the banking crisis, and UBA’s share price remained depressed. Market updates from the time reflect a continued bearish sentiment, indicating that UBA and other bank stocks were still struggling to regain their pre-crisis valuations.
In fact, it plummeted to around ₦1.00 in late 2008 ; UBA’s stock, traded at lower levels in 2010. the share price bounced at ₦11.00 in 2014, it fluctuated between ₦4.50 and ₦10.30 from 2015 to 2017. By 2015, the average share price was ₦3.63, reflecting lower valuation.
The bank’s share price plummeted to an all-time low of N1.80 on February 15, 2012, largely due to a loss after tax in 2011. This downturn was reflected in the share price, which remained depressed throughout most of 2012, with a price of N3.66 recorded in June. However, the bank’s fortunes began to change, and by 2015, UBA’s average share price had risen to N3.96, marking a notable recovery from the 2012 lows.
In 2015, the average share price was around N3.63 to N3.74, with a closing price of N3.74 on the floor of the exchange. However, the bank’s share price gained momentum, rising by over 41% in the third quarter of 2016 compared to its 2015 price, with a price adjustment to N4.31 per share due to a 20 kobo interim dividend declaration ¹ ² ³.
United Bank for Africa (UBA) Plc’s share price performance between 2017 and 2020 reflects the bank’s resilience and growth amidst evolving economic conditions. In 2017, UBA’s share price started at NGN 5.06 per share and climbed steadily, reaching NGN 8.55 by October. The momentum continued into 2018, with the share price closing at NGN 8.05 in August and NGN 7.70 on December 31. In 2019, UBA’s share price closed at NGN 7.15 per share, while the 2020 annual report revealed a closing share price of NGN 7.95 as of December 31, 2020. These fluctuations highlight the bank’s adaptability and strong financial performance, positioning UBA as a key player in Nigeria’s banking sector ¹.
United Bank for Africa (UBA) Plc’s share price experienced a remarkable surge in 2023, starting at around N7.25, soaring to a 96.1% year-to-date gain by mid-year, and closing at N25.10 per share on December 30, marking a significant increase driven by strong fundamentals and positive market sentiment ¹ ².
The fact is that those who bought this bank’s share at N34 then , no doubt, have not regained their investments today even at the peak of its stock price this year when the inflation and exchange rates today are compared to those of 2007 . This trajectory highlights UBA’s inability to navigate turbulent markets, taking the investors through a rocky road for years . However , the loss of the investors was the gain of UBA ; it swallowed N54 billion while its investors were gnashing their teeth in agony for year without recouping their investments.
UBA’s stock performance has been underwhelming, raising concerns about its leadership quality. Compared to its peers like Guaranty Trust Holding Company (GTCO) and Zenith Bank, UBA has lagged behind, showing little signs of challenging their dominance.
The difference between the sentiment of the investors towards UBA’s stock and GTCO’S is more defined by the qualities of their leadership . GTCO has been on a roll, with its share price hitting N101 . With a current share price of N93.00 and a market capitalization of N3.39 trillion, GTCO’s dominance is clear. Its share price has navigated a range of N50.00 to N103.20 over the past year, showcasing resilience and growth potential. A staggering 66.8% year-to-date gain underscores GTCO’s strategic prowess, while a price-to-earnings ratio of 6.20 highlights its attractive valuation These metrics position GTCO as a compelling play in Nigeria’s banking sector , the first NGX-listed financial company to cross the triple-digit threshold.
In contrast, UBA’s current share price stands at NGN 42.80, reflecting a solid 25.9% year-to-date gain . UBA’s share price has navigated a range of NGN 27.10 to NGN 50.51 over the past 52 weeks. At the current price, its market capitalization stands at N 1.76 trillion. For some observers, in terms of returns ,UBA , compared to a staggering 66.8% year-to-date gain recorded by GTCO remains a laggard . With the price differential between the two , GTCO is more valuable than UBA .The argument is this :from the above, one signal sent to the stock investors is the value differential between both two banks mentioned in terms of their market capitalization, or market cap, a key metric that reflects a company’s size, value, and market influence.
The issue is beyond that . The wide between the market value of GTCO relative UBA becomes more interesting when the wide gap between the resources at the disposal of their management and the number of their outstanding shares are considered. UBA has greater number of outstanding shares of approximately 41.04 billion compared to GTCO’s 36.43 billion .
United Bank for Africa (UBA) and Guaranty Trust Holding Company (GTCO) also present an interesting contrast in asset size . UBA’s total assets stand at N30 trillion, significantly outpacing GTCO’s N16.7 trillion as of H1 2025. This larger asset base positions UBA as a substantial player in Nigeria’s banking sector. Also , GTCO’s shareholders’ funds were N2.7 trillion as of December 2024, compared to UBA’s estimated N4.2 trillion net assets based on P/B ratio analysis. UBA’s broader asset base suggests a wider operational scope, and this is expected to be leveraged for better value delivery to its shareholders.
Both factors above are expected to make UBA a more valuable market entity than. GTCO. But this has not been the case . GTCO is not a bank that prioritizes size over efficiency , its financial metrics reflect its focus on profitability and innovation. The implications are no doubt palpable. GTCO higher stock price indicates strong investor confidence in its leadership, innovation, and growth prospects.
Its larger market cap solidifies its position as a banking giant in Nigeria, influencing market trends and sector performance. This may not be farfetched. Larger market cap companies like GTCO is perceived as more stable, while smaller market cap companies like UBA may carry more risk though offer higher growth potential. GTCO’s market cap makes it attractive to investors seeking stability.
A detailed analysis of the two market giants revealed the reasons why GTCO continues to dominate other banks including UBA in terms of market capitalization. The stock investors know they want, and that is what makes the difference between the corporate champions and the laggards: There are three main factors that determine the reaction of investors to a particularly stock . First , you have the fundamentals, the figures. You also take into consideration the economic situation prevailing in the country which is the macroeconomic consideration. In this you look at the government polices viz –a –viz the particular product or the company. Another thing is that you may have a good information regarding the quality of the management of a company; this can propel a demand for that share. The last consideration is hear- say..
Fundamentals play a crucial role in driving stock prices, as they provide insight into a company’s financial health and growth potential. Earnings and revenue growth, return on equity (ROE) and profit margins are key factors driving a stock price growth . Moreover, consistent dividend payments can attract income-seeking investors and stabilize stock prices, while companies operating in growing industries tend to outperform those in declining sectors, highlighting the importance of industry trends. Businesses with a sustainable competitive edge can maintain market share and drive stock price growth just as an effective leadership and strategic decision-making can impact investor confidence and stock prices, underscoring the role of management quality.
Some key metrics used to evaluate these fundamentals include the price-to-earnings (P/E) ratio, which compares a stock’s price to its earnings, the price-to-book (P/B) ratio, which compares a stock’s price to its book value, and dividend yield, which measures the return on investment from dividends. By analyzing these fundamentals, investors can better understand the drivers of stock prices and make informed investment decisions.
Furthermore, macroeconomic factors like interest rates, inflation, and GDP growth influence stock prices, demonstrating the disconnectedness of the broader economy and individual companies.
When the above factors are evaluated , there is no doubt that GTCO’s market performance above reflects the strong investor confidence in its innovative digital banking services, superior profit engine and diversified revenue streams . Moreover , its recent exemption by the Central Bank of Nigeria from the forbearance loan policy burden is an additional factor driving up its stock price . With a 66.8% year-to-date gain and a price-to-earnings ratio of 6.20, GTCO’s aggressive regional and global expansion strategy has positioned it as a benchmark for financial stocks in Nigeria.
Despite UBA’s diversified revenue streams across 20 African countries and offices in London, New York, and Paris that provide a unique advantage, shielding it from downturns in any single market , this could not deliver to it the hearts of the investors needed to gain the much needed market leadership and to create superior value for its investors .
The fact is that GTCO’s innovative and efficiency leadership makes it a compelling choice in Nigeria’s banking sector, appealing to different investor priorities and risk tolerance . A detailed analysis of UBA’s half year results confirms its laggard status when compared to a bank like GTCO . No doubt about it , UBA;s group’s H1 2025 results show sustained growth in its core operations, driven by a growing deposit base and a rise in interest income. Total deposits grew by +18.93%, reflecting customer confidence across markets. UBA’s lending and investment capacity improved as the group’s total assets rose by +17.40%, from N28.34trn in H1 2024 to N27.60trn in H1 2025.
However, while the above are critical for a corporate organization competitiveness in any industry, its inability to manage cost and risks , the two critical success factors in banking relative to a bank like GTCO remains its greatest challenges.
During the period under review, banks were expected to tap on high interest rates environment to boost their fortunes however, favorable impact of the high-interest rate environment on widening bank interest margin and top-line earnings comes with the threat of higher exposure to credit risk and macroeconomic headwinds. This played out in UBA’s financial numbers, with a higher non-performing loan (NPL) ratio.
Also , despite its impressive interest income in the period under review, its interest expense rose by +70.43% to N560.61bn in H1 2025 from N328.94bn, suggesting higher funding costs that affected its bottom line. Consequently , its pre-tax profit declined by -3.28%, likely due to the sharp increase in interest and operating expenses.
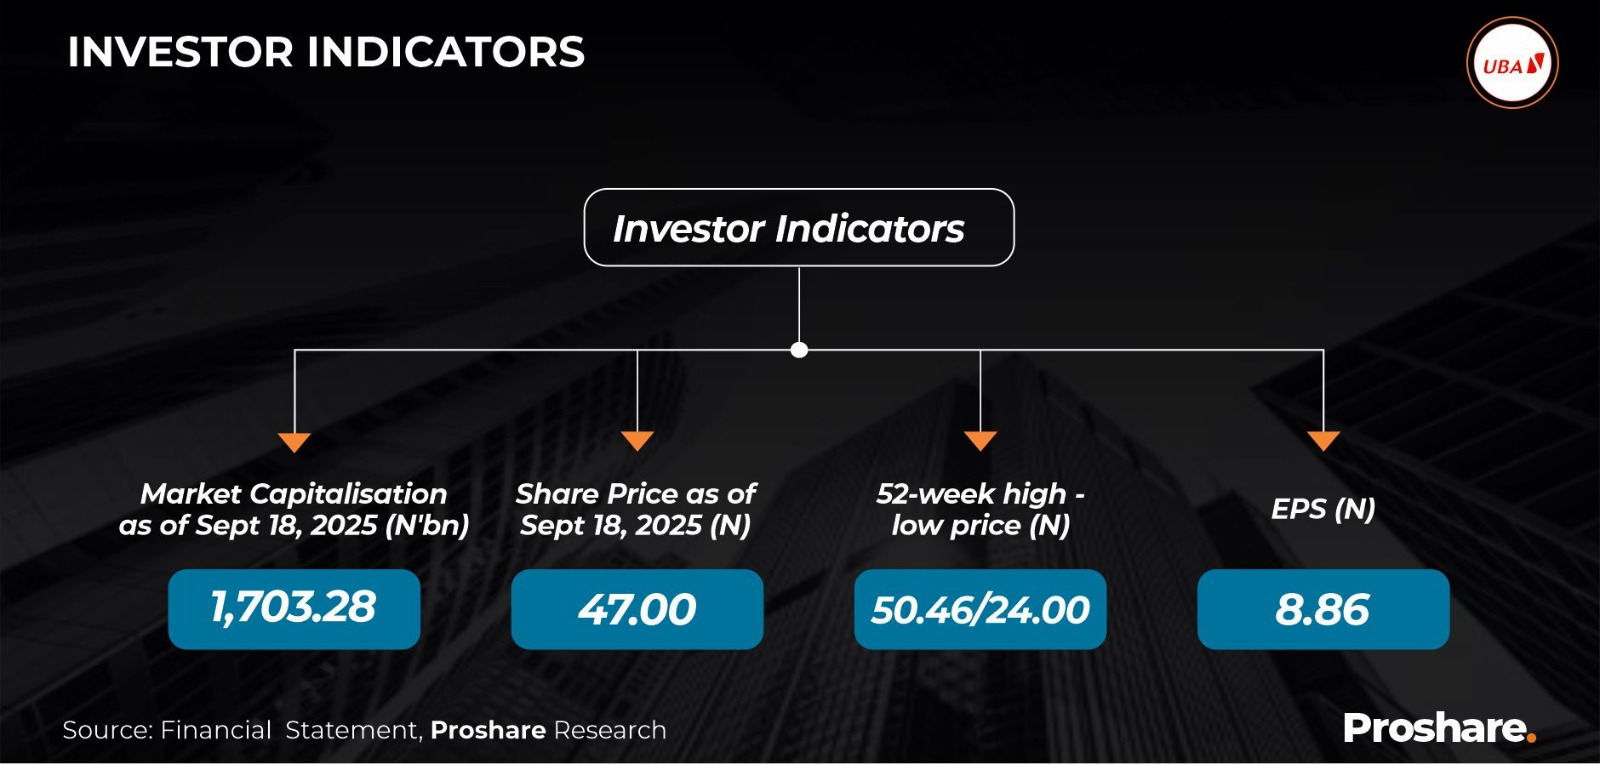
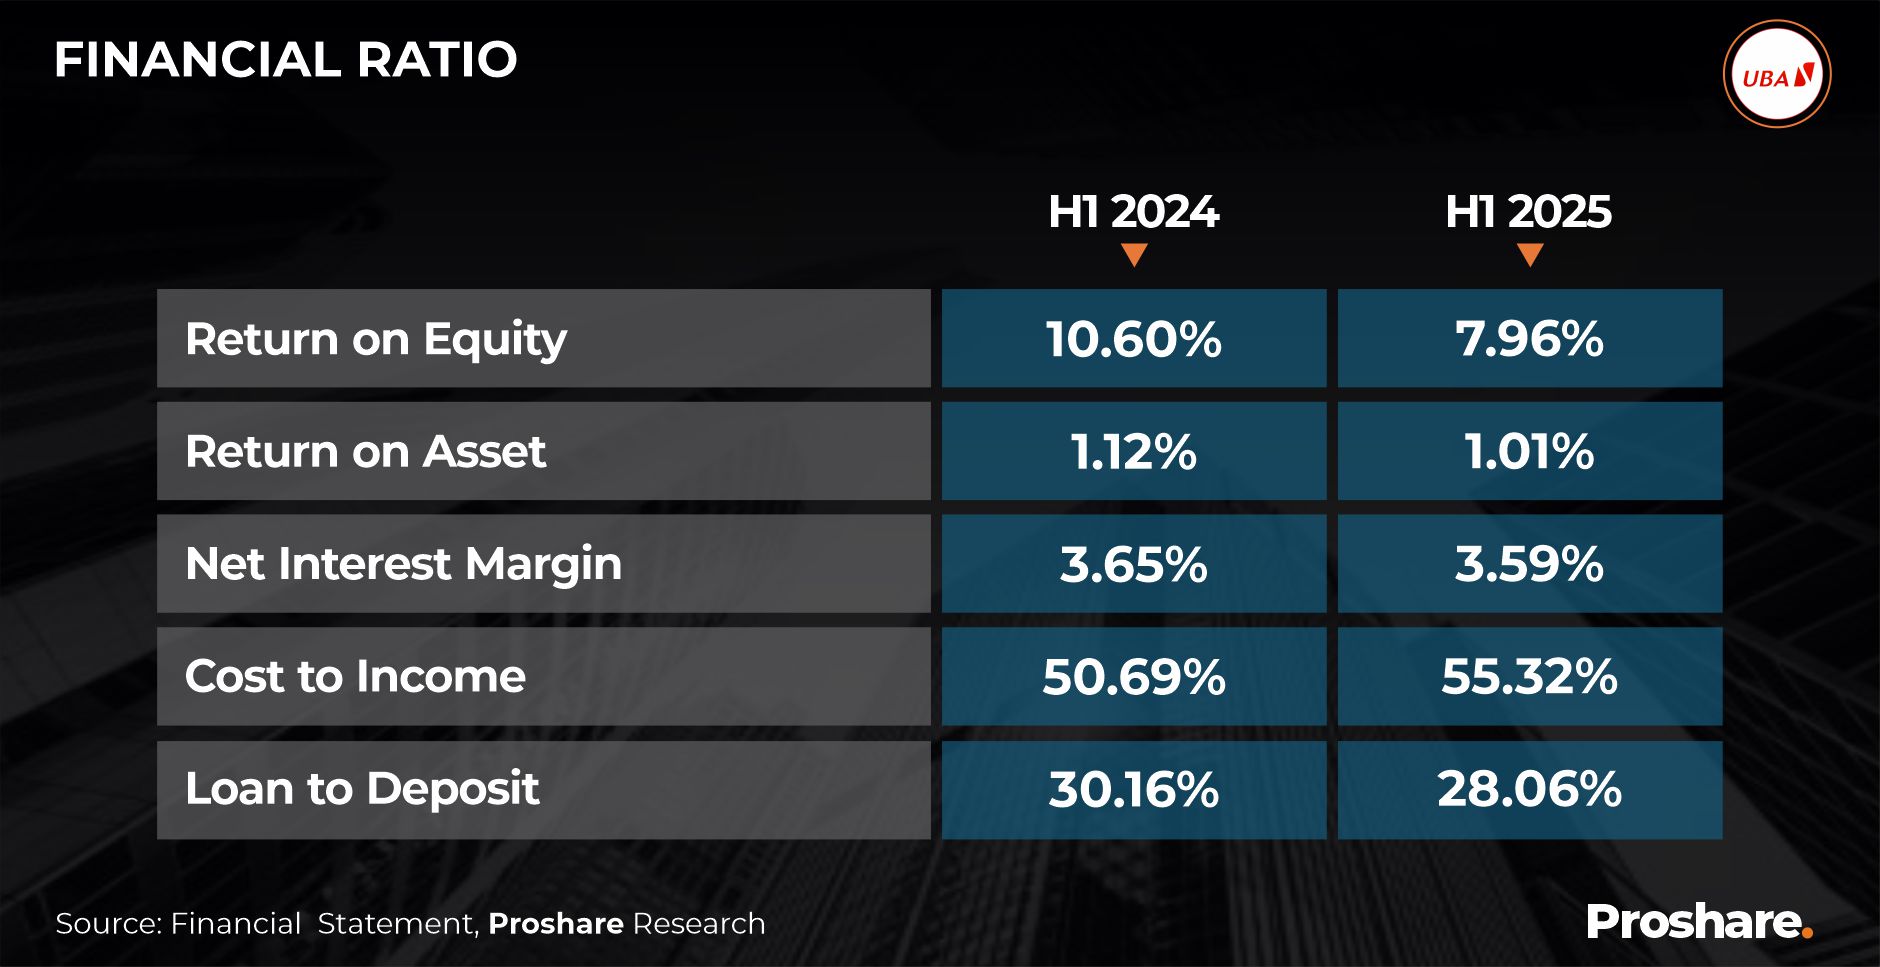
UBA group’s net interest margin (NIM) slightly dipped to 3.59% in H1 2025 from 3.65% in H1 2024, suggesting tighter spreads. The Cost-to-Income ratio deteriorated from 50.69% to 55.32%, indicating increased cost pressure possibly due to inflation, tech investments, or regulatory costs. Loans and Advances increased by 10.68%, reflecting a modest expansion of credit. Investment Securities rose by 19.66%, indicating strategic portfolio positioning in high-yield assets. Loan-to-Deposit Ratio fell to 28.06% from 30.16%, implying conservative lending or a surge in deposits outpacing credit creation (see
Illustration 1:

Table 1:

Table 2).
Table 2:

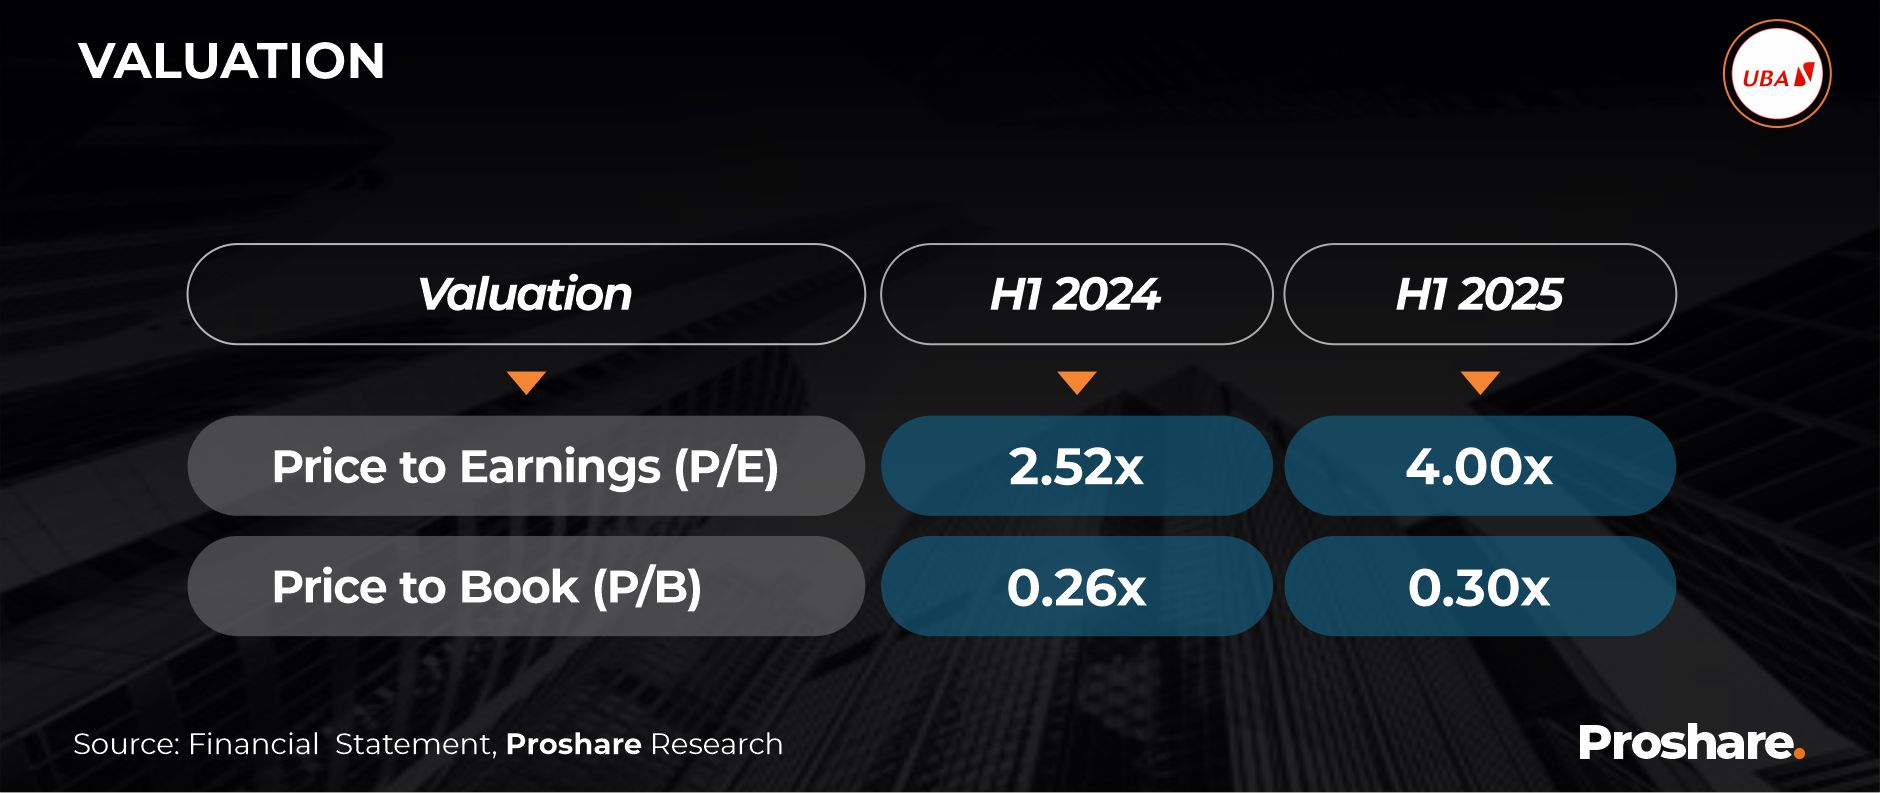
The group’s price-to-earnings (P/E) ratio of 4.00x in H1 2025 (compared to 2.52x in H1 2024) remains relatively low, signalling undervaluation of its stock. Similarly, the price-to-book (P/B) value increased to 0.30x in H1 2025 from 0.26x in H1 2024, indicating that the company is priced below its book value (see Table 3 below).
Table 3:

Opinion
UBA’s H1 2025 result indicates a resilient but margin-pressured performance. The bank delivered strong growth in earnings and assets, backed by an expanding deposit base and rising investment income. However, profit margins and efficiency ratios are under stress due to increasing costs.
UBA is currently trading at a significant discount to its book value and earnings, indicating an attractive entry point for long-term investors. Analysts’ consensus on investing in UBA stock suggests increasing trading volume; most capital market operators (CMOs) advise a buy, while a few recommend accumulation.


