
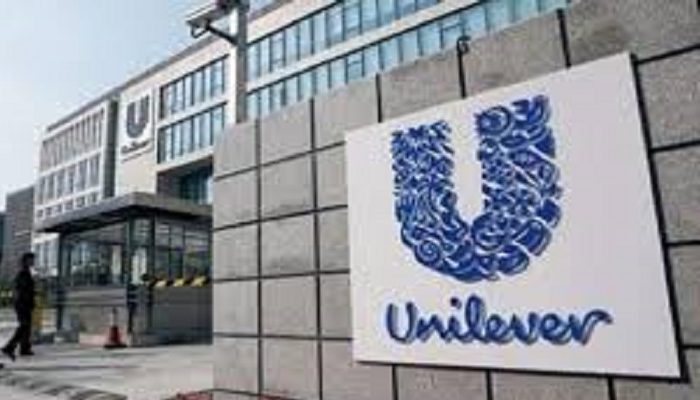
On paper, Unilever Nigeria Plc had a stellar 2026. Nine-month profit jumped 20.1% to N26.4bn from N21.98bn, Q3 profit surged 42.6% to N10.8bn from N7.57bn, and EPS rose to N4.60 from N3.83. But behind the headline is a company fighting a brutal balancing act: growing profit while operating cash collapsed 68.7%, paying N30.1bn dividend from a N10.2bn operating cash flow, and spending N8.95bn on new plants while costs run wild.
Unilever Nigeria’s 9M 2026 is a textbook case of profit-rich, cash-poor brilliance under pressure: it grew profit 20.1% to N26.4bn by weaponizing pricing power to lift gross margin to 46.44% from 41.15%, yet that P&L strength masks a dangerous cash reality where operating cash collapsed 68.7% to N10.2bn because N28.2bn is trapped in inflated inventories, N16.3bn in ballooning receivables, and N20.4bn was paid in tax, forcing the company to fund a tripled N30.1bn dividend – 114% of profit and 294% of operating cash – and an 821% surge in capex to N8.95bn from its historic N110.7bn cash pile, which has now bled to N91.3bn with retained earnings falling despite profit; the implication is stark: Unilever bought time, market share, and shareholder loyalty with its balance sheet, but this balancing act of spending on growth, costs, and dividends while cash generation deteriorates is unsustainable, and unless receivables convert, inventory normalizes, and marketing costs growing at 36-63% moderate, the next 12 months will force a painful choice between cutting dividend, halting expansion, or seeking debt in a 30% interest rate environment, turning today’s margin victory into tomorrow’s liquidity crisis.
How it survived reveals a masterclass in deploying strengths to neutralize existential threats..The most striking deployment of strength was how Unilever used its brand equity and pricing power to neutralize cost inflation, which is its biggest weakness and threat. In 9M, revenue grew 18.4% to N184.0bn, but cost of sales grew only 7.7% to N98.5bn. That divergence lifted gross profit 33.6% to N85.4bn and expanded gross margin from 41.15% to 46.44%. In Q3 alone, the story was even sharper: revenue up 11.8% to N64.08bn while cost of sales actually fell 5.9% to N33.35bn, pushing Q3 gross profit up 40.6% to N30.7bn. In an environment where FMCG peers are being crushed by FX, energy and imported raw materials, Unilever turned its heritage brands into an inflation shield. It raised prices, optimized mix towards premium personal care and household products, and forced efficiency through its supply chain, effectively using gross margin expansion to pay for its own weaknesses.
Those weaknesses were severe. Selling and distribution expenses jumped 44.1% to N7.31bn in 9M and marketing and administrative expenses surged 36.5% to N40.3bn. In Q3, marketing and admin exploded 63.6% to N13.9bn from N8.5bn. Combined operating expenses consumed N47.6bn, and impairment write-backs that boosted last year by N834.9m collapsed to just N43m, a 94.8% drop. Without the gross profit cushion, operating profit would have collapsed. Instead, operating profit still grew 26.5% to N38.54bn in 9M and 21.7% to N14.18bn in Q3. Unilever consciously chose to overspend to defend market share and volume in a shrinking consumer wallet environment, and funded that overspend from the pricing gains at the top. It also deployed its second great strength, its fortress balance sheet, to neutralize its cash flow threat. Net finance income of N7.03bn in 9M, driven by N9.16bn interest income on its massive cash pile, contributed 15.4% of profit before tax. With N91.3bn in cash, 50.9% of total assets, and only N1.95bn in loans, it could afford to be debt-free while rivals pay 30% interest on working capital loans. That interest income softened the blow of a 42% effective tax rate and a tax bill that doubled to N20.4bn paid.
The opportunity exploitation is seen in how it managed its cash burn strategically rather than defensively. Operating cash fell to N10.26bn from N32.82bn because inventories rose 22.4% to N28.28bn, receivables spiked 55.6% to N16.33bn, and prepayments rose to N9.63bn. Ordinarily that is working capital mismanagement, but in Unilever’s context it is a deliberate hedge: stockpiling raw materials ahead of further naira depreciation and extending credit to keep distributors afloat. More critically, it invested N8.95bn in property, plant and equipment, an 821% increase from N1.08bn last year, growing its PPE base to N30.85bn from N24.4bn at year-end. While paying an aggressive N30.16bn dividend, 114% of its profit and triple last year’s N10.05bn, which depleted retained earnings to N44.01bn from N47.77bn and drove a N19.4bn net cash decrease, it was simultaneously building future capacity. It used accumulated cash of N110.7bn at the start of the year to both reward shareholders and fund expansion, a high-wire act only possible because of its historic cash accumulation.
Q3 validates that the strategy is working in the short term. Despite a N248m impairment loss versus a N292m write-back last year, and finance cost doubling to N436m, Q3 PBT still grew 23.7% to N16.4bn because finance income grew 44.6% to N2.65bn and gross margin held. The 3-month performance shows Unilever has learned to make its balance sheet work harder than its income statement, using interest income to offset operational volatility.
The critical question remains sustainability. Unilever neutralized this quarter’s weaknesses, but it did so by consuming its own buffer. It paid more dividend than profit, more dividend than operating cash, and funded it from reserves. Current tax liabilities at N17.1bn and deferred tax quadrupling to N1.56bn show fiscal pressure is not easing. If revenue growth moderates from 18.4% and operating expenses continue to grow at 36-44%, the pricing shield will crack. For now, Unilever’s 9M story is not just about profit growth, it is about how a strong brand and a cash-rich balance sheet can buy time, defend market leadership, and invest for the future even when cash flow and cost structures are flashing red.